Overview of BigBlueButton Exporter#
BigBlueButton Exporter is a Prometheus exporter for BigBlueButton.
On a HTTP /metrics request, the exporter will query the BigBlueButton's API for data which it then aggregates and exposes as metrics.


Metrics exposed:
- Number of participants by type (listeners, voice, video)
- Number of participants by client (HTML5, dial-in)
- Number of recordings (processing, published, unpublished, deleted, unprocessed)
- Number of participants in rooms by bucket
- ...and more, checkout exporter docs for details.
Use Case#
BigBlueButton Exporter is the bridge between BigBlueButton and modern monitoring infrastructure such as Prometheus, Alertmanager & Grafana.
Using BigBlueButton Exporter you can create stunning dashboards for your BigBlueButton infrastructure and create alert rules when certain things happen.
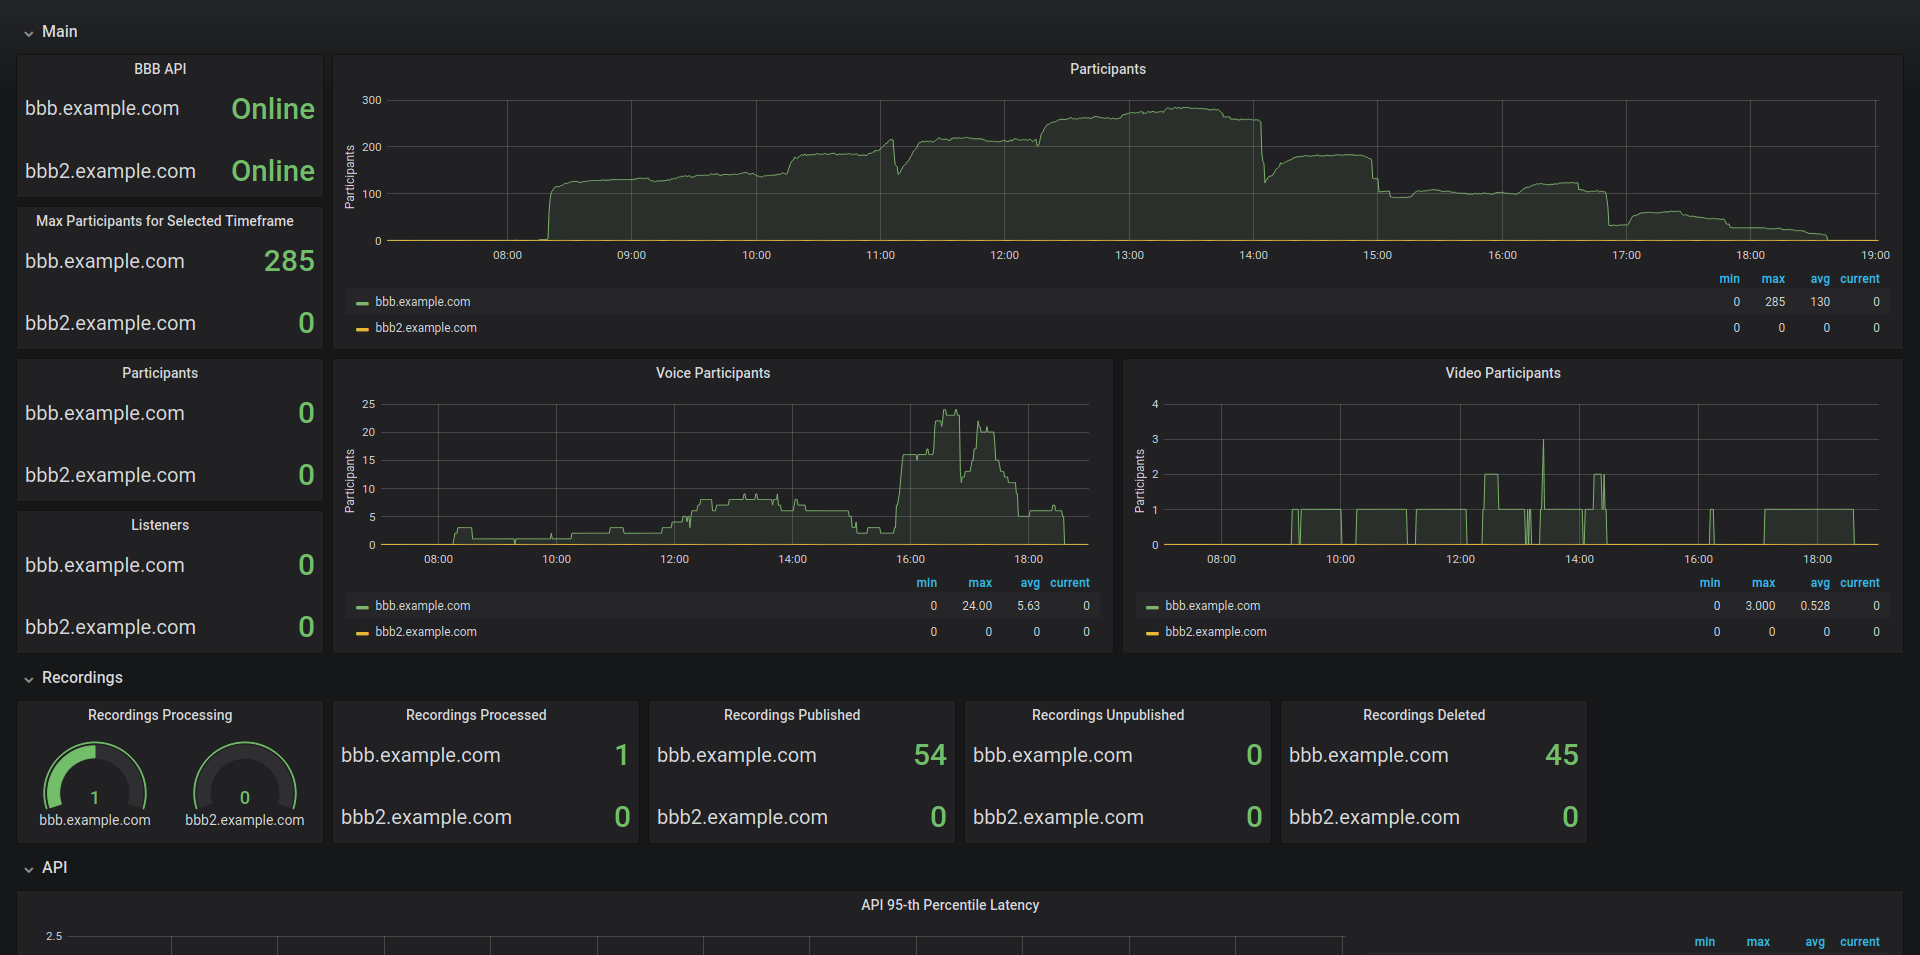
Multiple BigBlueButton servers dashboard#
With this dashboard you have a quick overlook over all your BigBlueButton servers and quickly spot anomalies.
Single detailed BigBlueButton server dashboard:#
This dashboard gives you details about a single BigBlueButton server and it's performance compared to it's resources (CPU utilization and network bandwidth).
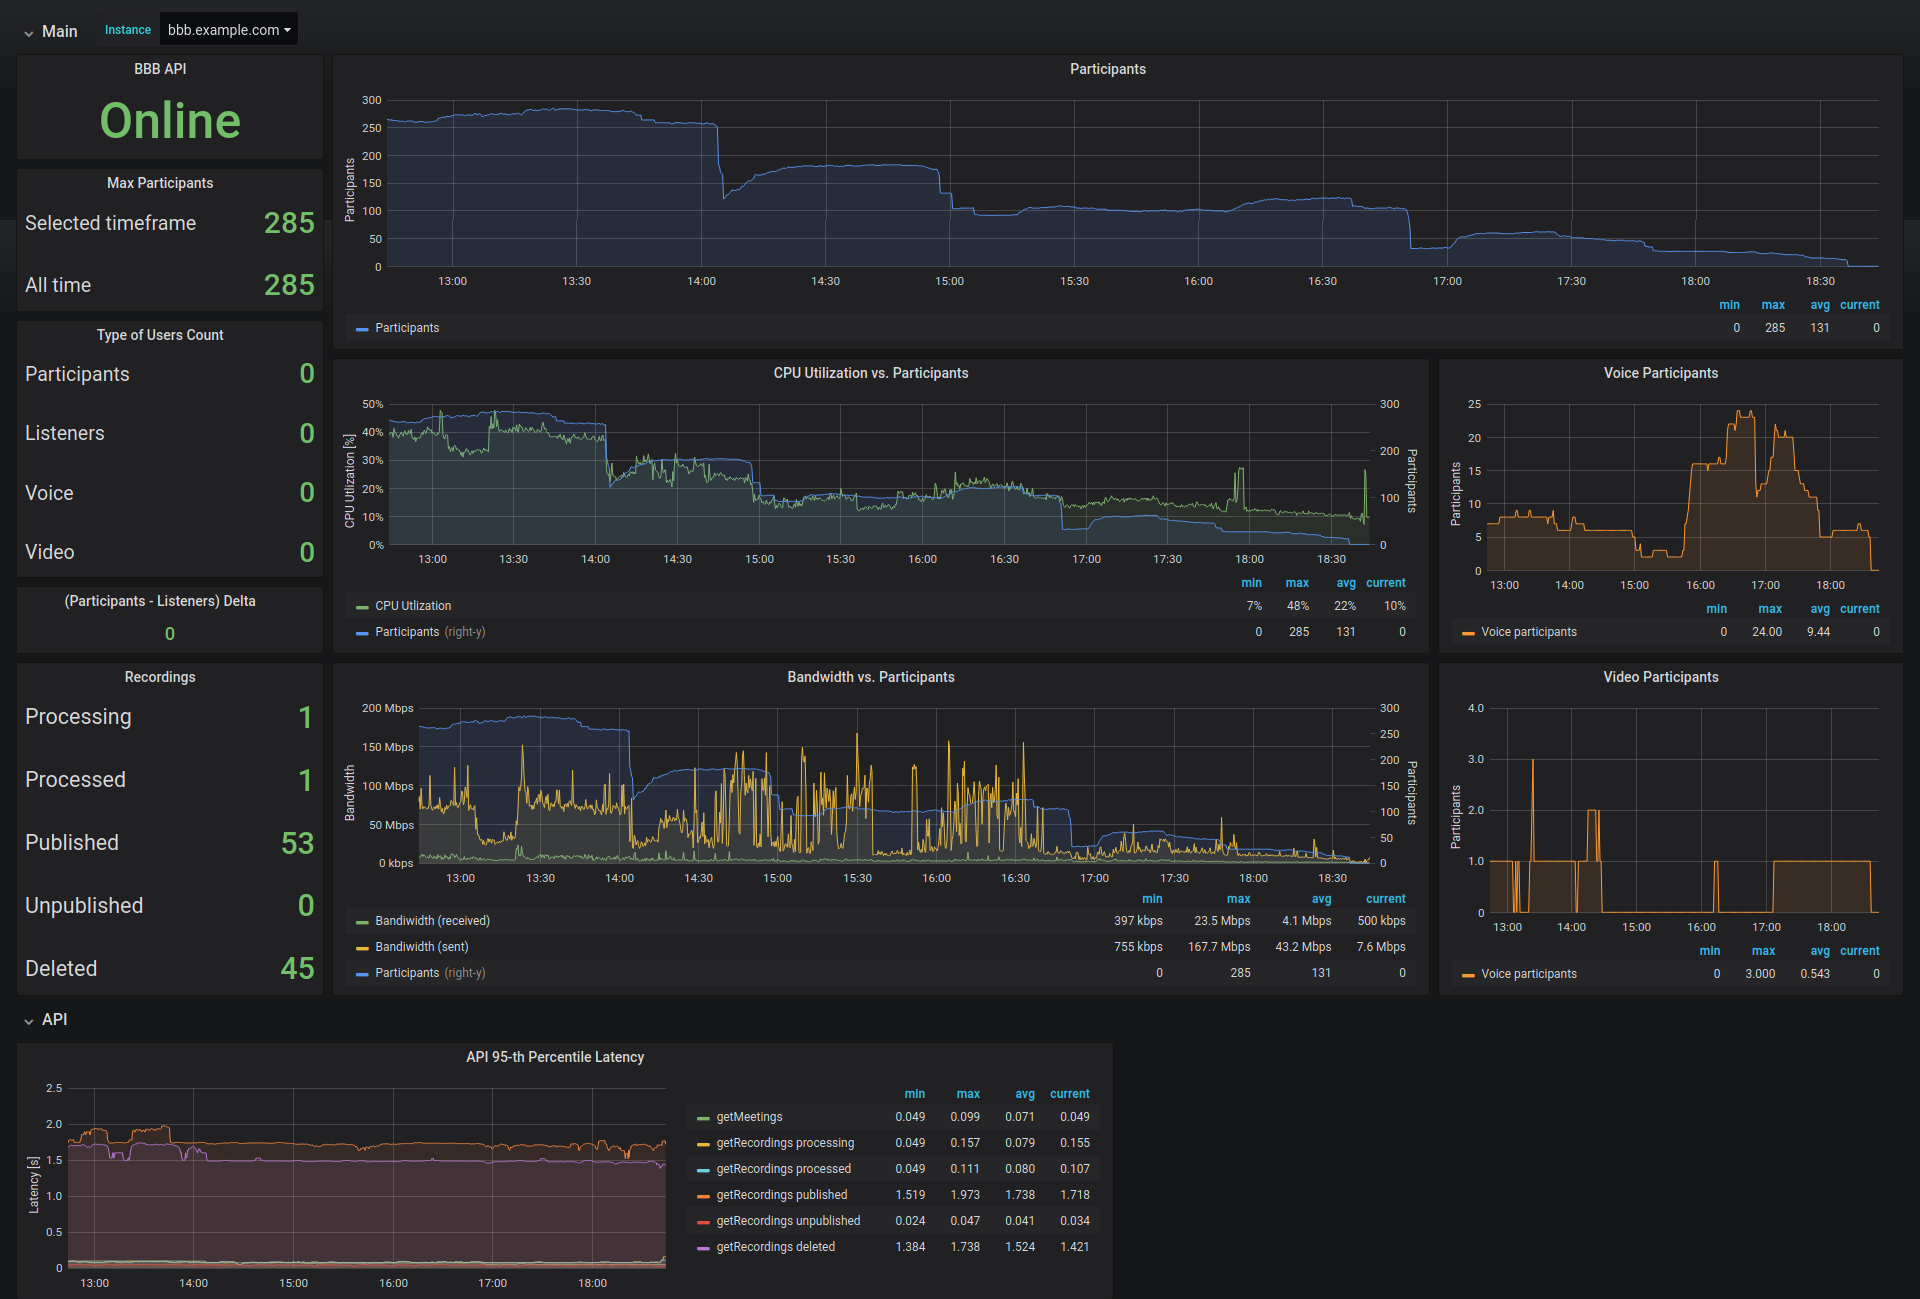
Note
Additional software is required to display server resources i.e. node_exporter or Netdata. We cover this in the installation instructions.